Working with Gantt chart
Gantt Chart is an interactive chart where you can drag and drops items (Jobs) on a timeline.
Gantt chart is found in two XTRF areas:
- Schedule button in the Vendors view.

- Jobs card on the Smart Project page. Click on the
 Settings Icon and select Schedule View.
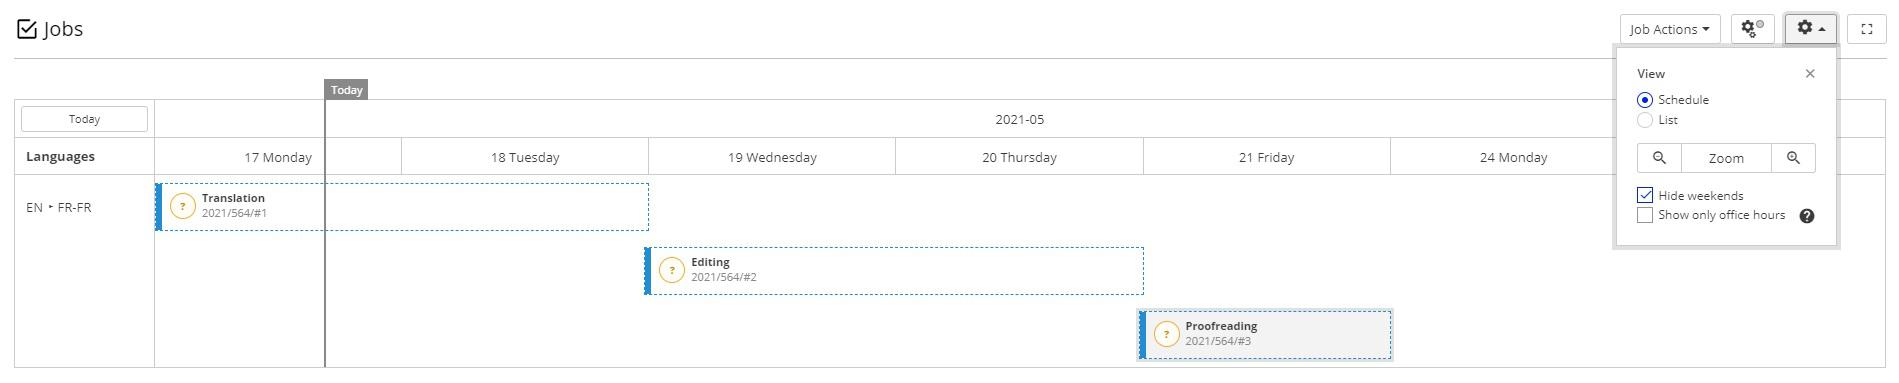
Both of these places show individual jobs that are interactive, ie. you can drag&drop them to change both, start and end times. The job blocks can also be extended or shortened. The operations depend on status:
- Started jobs only allow deadline change
- Finished jobs do not allow any date modification
There are a couple of features that you can access:
- Today brings you to the current day.
- Scroll (< > icons) lets you move forward and backward in time.
- Zoom in / out (+ and - icons) lets you see bigger or smaller timeframe.
- Popup appears when you click on a job block. It shows some details like language combination, or vendor contact person. It is where the deadline can be adjusted, when job was started earlier or later than planned. You can also follow the link at the bottom to the smart project and see all the details.
- Gear icon is there to hide weekends, and show canceled or overlapping jobs.
Customer support service by UserEcho
